It’s that time of the marketing year again. A crazy and hectic time. And you know that as a marketer you have to make the most of it.
Making the most of it usually comes with working around data. But for many marketers it can be really challenging task.
This guide will cover analytics that will help you make the most of your Black Friday campaign, scale revenue and ROAS as well as avoid unnecessary budget losses on non-performing initiatives, channels or ads.
Here we will cover:
- How to set up ad tracking for your Black Friday marketing campaign
- How to make sure you gather accurate data
- How to use the collected data as an insight discovery tool
- How to scale your revenue during Black Friday with the use of analytics
Step-by-step: How to set up analytics for your Black Friday campaign
Let’s start our step-by-step guide for successful tracking and analytics during BFCM.
Step 1: Choose analytics tool
This is step number 1 and it’s gonna define the quality of your analytics, as well as expected result. You might have a temptation to use Google Analytics to track your performance during Black Friday. But I would like to instantly make you doubt this decision.
Even though Google Analytics is amazing for tracking your website performance, it’s not gonna do such a good job at tracking the performance of your campaigns, especially if you multiple marketing channels: paid ads, influencer marketing, email marketing, etc.
So I would really offer you to consider a Google Analytics alternative.
In order to successfully run analytics during Black Friday, you will need to get to the understanding of ad tracking.
With the right analytics tool you will be able to:
– gather performance data across marketing channels you are using
– perform server-side tracking that will ensure accurate data
– get a single dashboard to analyze all performance results
– track everything: clicks on paid ads, link clicks around the web or in your socials, promo codes from influencers, affiliates’ performance & more.
If you wanna analyze marketing data and optimize your performance, you should check the analytics & automation solution from RedTrack.
Step 2: Plan out events you wanna track
Next step would be analyzing your campaign from the point of the events you want to track during Black Friday. Possibly, you might consider building a funnel out of tracked events.
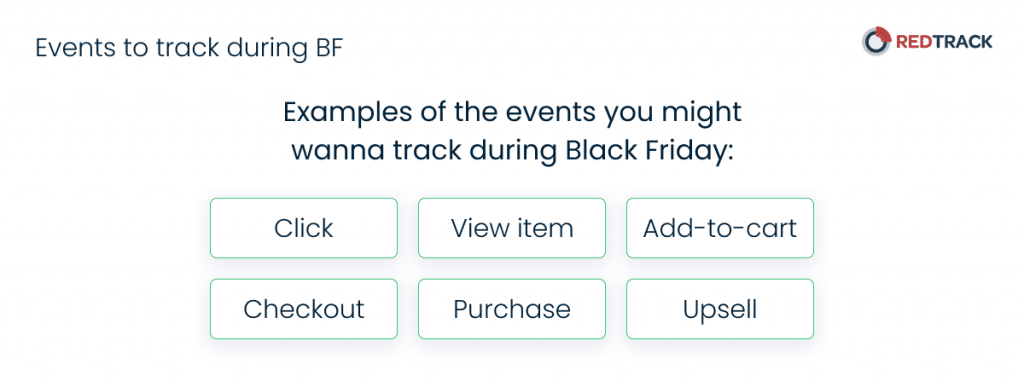
Examples of the events you might wanna track during Black Friday:
- Click
- View item
- Add-to-cart
- Checkout
- Purchase
- Upsell
What could be your tracking funnel?
As an example you can think of sales funnel like that:
Click — View item — Add-to-cart — Checkout — Purchase
Step 3: Take care of integrations & set up tracking
If you choose your analytics tool wisely, this step should come easy. Why?
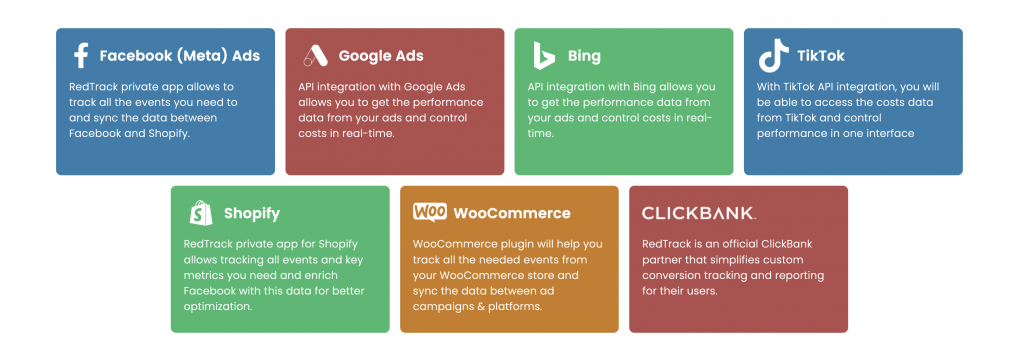
Because you will have templates for integrations with all the necessary platforms: marketing channels (FB Ads, Google Ads, TikTok Ads, Bing, Taboola, Outbrain), e-commerce platforms, affiliate networks, CRMs, finances, data visualization, etc.
In case of RedTrack, we have 200+ integrations that will simplify the work when it comes to creating a unified tracing & analytics system.
- You will be able to connect your paid channels (Google, FB, TikTok,etc.) via API integrations and perform server-side tracking. Meaning having accurate data about clicks, conversions and costs of each campaign.
- You will be able to connect your e-commerce platforms (Shopify, WooCommerce, BigCommerce, etc.) to connect your shop with the marketing channels and align data
- You will be able to connect it to your CRM (like HubSpot) or connect Tableau (to visualize data)
Take care of installing scripts, pixels, and tracking links
Ad tracking is based on tracking parameters (UTMs).
UTM parameters were implemented by Google for Google Analytics tracking, but today most tracking systems implemented their own tracking parameters for analytics.
Example of a tracking link with UTM parameters
https://bootsshop.com?cmpid=5e6c7b85c6565a0001718aa0&sub1={replace}&utm_keyword={keyword}&sub4={adgroupid}&sub5={creative}&sub6={campaignid}&sub8={adposition}&ref_id={gclid}
Everything that goes in {} are tracking parameters: keyword, adgroudID, creative, position etc.
After a user clicks this link the parameters will be exchanged on real values coming from this particular user: which keyword was used, which ad group the ad corresponds to, the campaign ID, etc.
🚀Read a detailed guide on what is ad tracking here.
Every channel has a different and unique approach when it comes to installing tracking. Generally, when it comes to using an e-commerce ad tracker you will set up pixels when integrating the channel with the tracking system. You will get templates in order to do that so it won’t be a big problem.
Even better if you have native integration between your e-commerce platform and tracking system because then you are able to collect data about the conversions (or purchases) and send it to advertising platforms for improving the work of the optimization algorithms (maximizing signals).
Another important feature you should be looking out for is the Universal tracking script.
💡With RedTrack.io’s universal script you are able to place it on your website to collect the clicks from any source and easily build multichannel reports. 💡
Step 4: Verify data accuracy
The next step to ensure your accurate step would be to verify data accuracy between various systems.
Compare the stats that your Ads Manager shows or Google Analytics, for example, with the results of the tracking tool you use and the backend data about the purchases.
If the data doesn’t match you will have to perform additional actions to align it.
What’s an okay discrepany in conversion data?
This is a very complex question and it depends on your marketing channels, as well as on your shop set up. Usually, the data should match close to 100%.
But in our experience, many users try to fight “the discrepancy issue”. If you are only looking at Facebook data, you won’t get 100% accuracy. The reason for that is Facebook attribution models.
The same happens with the whole Google ecosystem. Both Facebook and Google are self-attribution networks. It means that these channels are advertising platforms (and you pay them to run ads) and they report their success (which means it’s really beneficial for these platforms to report better numbers). Many times Google and Facebook might be misinforming you on the performance shown simply because the system is built this way.
That’s why it’s super important to use independent and unbiased marketing analytics tools, like RedTrack.
We collect all the data via API integrations independently to ensure data accuracy and matching across all platforms. In-build integration with Shopify allows to receive the data from the back-end of the store and send all the needed conversion data to advertising platform to improve the performance, which is a great bonus.
However, if the data between your ad tracker of choice and the back-end of the store doesn’t match, continue troubleshooting.
- Check the accuracy of the setup parameters
- Try to integrate advertising channel one more time
- Verify that all pages have tracking script installed
If you add anything to your tracking setup, make sure to follow the same (initial) logic to ensure that everything will be recorded and reported accurately.
Step 5: Set up automation (if your tool allows it)
One extra step when it comes to impeccable tracking & analytics system is automation.
When you get access to performance data collected through your tracking tool, you might wanna use it to prevent ad loss and scale what works. And that’s exactly what automation is there for.
That is something that you won’t find in Google Analytics, so you will need an analytics & automation platform for that.
With RedTrack’s Automation Extension you will be able to:
- Receive up to 1-minute cost updates from your campaigns. This feature is extremely important if you have larger ad spend. The more you spend, the more often you might wanna receive data about the spending and direct the budgets to the ads that work.
- Create Stop & Go Rules. Set up the rules for your campaigns to manage them. For example, if CR < 3%, then stop the campaign. It’s an easy AI technique that will help to spend less time monitoring and more time enjoying the fruits of the campaigns.
- Create Scale Rules: Change budget or change bids to scale performance based on the Cost, CPA, Conversion, ROI, Revenue, EPC, and other performance metrics. One rule can be applied to multiple campaigns.
If you wanna learn more about Automation Extension from RedTrack, check the solution here.