We’ve all shopped online. But have you ever caught yourself thinking how this online store seems to know exactly what you want and when you want it? Most likely such e-commerce businesses utilize data analytics to better understand their customers. This comes with the mutual benefit of more satisfied shoppers and higher revenue. But which data can help you increase the average order values? And where do you start with analytics? We have some answers below.
What Is E-Commerce Analytics?
E-commerce analytics means collecting and studying e-commerce data from online stores to help businesses make better decisions. E-commerce performance analytics includes tracking important numbers like sales, customer actions, and how well the website works. Businesses can learn useful information that helps them improve their marketing efforts, make shopping better for customers, and increase their profits by using e-commerce analytics tools. When businesses understand how customers use their online store, they can adjust what they offer and improve their overall success in a competitive market.
Why Is E-Commerce Analytics So Important?
Analytics in e-commerce is very important for the success of online businesses. It helps companies collect and study large amounts of data from customer interactions. This data gives valuable information about what customers like and how they behave, allowing businesses to make smart choices. For example, by looking at buying patterns, companies can see which products are popular and change their stock to meet demand.
E-commerce analytics also helps businesses check how well their marketing campaigns are working. Knowing which strategies get the best results can help companies use their resources better, leading to more profits. Using these insights is key to staying competitive and meeting customer needs effectively.
What Metrics are Shown by E-Commerce Analytics Software?
E-commerce analytics software provides a wide range of metrics that help businesses evaluate their performance. Understanding these metrics is important for making data-driven decisions that drive growth.
Customer Lifetime Value (CLV)
Customer Lifetime Value is a key metric that shows how much money a business can expect to make from one customer during their time with the company. Understanding CLV helps businesses focus on keeping their current customers happy instead of just trying to get new ones. For example, if a regular customer buys from the store many times, knowing their CLV allows businesses to create special marketing plans that help them earn more from that customer. This information encourages companies to invest in loyalty programs or personalized marketing that makes the shopping experience better for customers.
Customer Retention Rate (CRR)
Customer Retention Rate measures the percentage of customers who keep buying from a business over a certain time. A high CRR shows that customers are loyal and happy with the brand. Businesses can find out what keeps customers coming back and develop plans to strengthen their loyalty by looking closely at CRR. For example, if the data shows that customers who interact with specific content are more likely to return, companies can create special campaigns that encourage these interactions. In the end, improving CRR helps businesses boost sales while keeping customer acquisition costs low.
Shopping Cart Abandonment Rate
The Shopping Cart Abandonment Rate shows the percentage of customers who add items to their cart but do not finish the purchase. When this rate is high, it can mean there are problems with the checkout process or the prices of the items. Businesses can find out what stops customers from completing their purchases by looking closely at this metric. For example, if many customers leave their carts at a certain point in the checkout process, it might mean they are confused or frustrated with that step. Fixing these issues can greatly lower abandonment rates and help more customers complete their purchases.
Customer Acquisition Cost (CAC)
Customer Acquisition Cost measures how much money a business spends to gain a new customer. This cost includes expenses for marketing campaigns, sales efforts, and any other resources used to attract customers. Knowing the CAC helps businesses see how well their marketing strategies are working and make sure they are spending their money wisely. If the CAC is too high compared to Customer Lifetime Value (CLV), it could mean that the marketing efforts need to be looked at again or improved. By reducing CAC through targeted advertising or using more effective marketing channels, businesses can increase their profits.
Bounce Rate
Bounce Rate measures the percentage of visitors who leave a website after looking at just one page. A high bounce rate means that many visitors are not finding what they want or that the website is not interesting enough to keep them around. Businesses can find parts of their website that need improvement by looking closely at bounce rates. For example, if certain pages have high bounce rates, it might be a good idea to improve those pages with better images or more useful information. This can help keep visitors interested and encourage them to explore more of the site.
How to Leverage Data to Drive Sales with E-Commerce Analytics
Here are some easy ways businesses can use this data to their advantage:
- Personalization — Use customer data to create shopping experiences that feel personal and special. Businesses can suggest products they might like by looking at what customers have bought before and what they browse. For example, if someone often buys sports gear, the website can show them workout clothes or accessories. This personal touch makes customers feel appreciated and encourages them to shop again.
- Targeted Marketing — Look at customer demographics and behaviors to create marketing campaigns that reach the right people. This way, businesses can send messages matching what different customer groups want. For example, a store might send special deals on toys to parents or discounts on travel bags to people who travel often. Businesses can get more attention and increase sales by focusing on specific groups.
- Optimize User Experience — Regularly check how users behave on the website to find problems in their shopping experience. This includes seeing where customers leave the site or which pages they do not stay on long. Making changes based on this information can help keep customers happy and increase sales. For instance, making the checkout process easier or improving website navigation can help customers finish their purchases without frustration.
Analytics vs. Metrics vs. KPIs
Understanding the differences between analytics, metrics, and KPIs is essential for effective e-commerce performance evaluation.
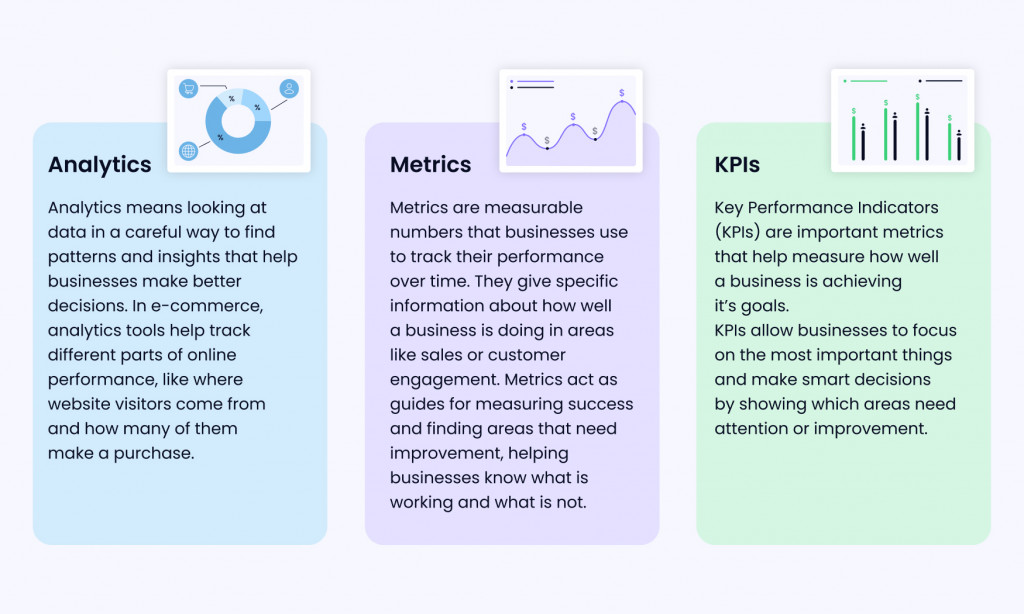
- Analytics — means looking at data in a careful way to find patterns and insights that help businesses make better decisions. In e-commerce, analytics tools help track different parts of online performance, like where website visitors come from and how many of them make a purchase.
- Metrics — are measurable numbers that businesses use to track their performance over time. They give specific information about how well a business is doing in areas like sales or customer engagement. Metrics act as guides for measuring success and finding areas that need improvement, helping businesses know what is working and what is not.
- KPIs — key performance indicators are important metrics that help measure how well a business is achieving its goals. KPIs allow businesses to focus on the most important things and make smart decisions by showing which areas need attention or improvement.
Key Metrics for Enterprise Business Success
For enterprise-level e-commerce businesses, tracking key metrics is essential for sustained success:
- Pages per Visit — measures how many pages a user looks at during one session on an e-commerce site. A higher number means users are more engaged and interested in the products offered. This metric helps businesses find which products are popular and allows them to improve their website design to make the shopping experience better for visitors.
- Returning Visitors — tracks the percentage of users who come back to the site after their first visit. A high rate shows customers are loyal to the brand and happy with their previous experiences. Understanding this metric can help businesses improve their marketing strategies and build strong, long-lasting relationships with their customers.
- Time on Site — measures how long visitors spend on an e-commerce site during each visit. Longer times usually mean that users find the content interesting or useful. Looking at this metric helps businesses see how well their content is working and make changes to keep users engaged and wanting to explore more.
- Customer Lifetime Value (CLV) — estimates how much money a business can expect to make from a single customer over the entire time they do business together. Knowing CLV helps businesses focus on keeping customers and making the most profit over time. This information allows companies to create marketing efforts that support and strengthen important customer relationships.
- Page Load Time — tells us how quickly a web page opens for users. Faster load times create a better user experience and lower bounce rates, which means more people stay on the site and make purchases. Keeping an eye on this metric helps businesses find technical problems and improve their website’s performance.
- Customer Acquisition Cost (CAC) — is important for checking how well marketing efforts are working and making sure the business can grow steadily. CAC measures all the costs involved in getting a new customer, including advertising expenses. Looking at CAC along with CLV can surely help businesses improve their marketing strategies to get better returns on their investments.
Subscribe to our newsletter for exclusive tips on ad tracking, affiliate marketing, and targeted advertising strategies.Unlock Insights!
How RedTrack Supports Your E-Commerce Analytics
RedTrack provides complete solutions like Conversion API for e-commerce analytics that help businesses make smart choices based on clear data insights. With features that track conversions across different channels and work well with various e-commerce platforms, RedTrack enables businesses to improve their online strategies. RedTrack’s tools help companies understand customer behavior better and streamline their operations to work more efficiently.
For more information about how RedTrack can enhance your e-commerce analytics efforts, visit their website.
Wrapping It Up
Using e-commerce analytics well can greatly increase sales and profits for online businesses. Understanding key metrics and data can help companies make smart choices that help them grow and perform better in a competitive market. Businesses should leverage data analytics in e-commerce to not only improve marketing efforts but also make the shopping experience better for customers, which can lead to more profits.
With the world quickly progressing, using e-commerce analytics tools is essential for success. Start using these insights now to reach your business’s full potential!


