
“I was just scrolling my Facebook feed and I saw **’ s post. His story had a strong impact on me and I decided to go into the media-buying industry.”

“I saw this trick in one of ** ‘s blog posts and decided to try it”.

These are the typical answers you’ll get when asking media-buyers about their becoming. And It’s not a big surprise really. Everyone loves case studies and success stories. Well-written ones can fill you with hope, give you valuable tips and help to look at an unsolvable task from a different angle. To be honest, you can often find the RedTrack team reading innovative companies’ stories during the break. BUT. There’s a thing with them. Pretty much often people take other’s stories as ready-made guides to action and copy their tactics, expecting to achieve the same results.
Unfortunately, this is not how things work here. We can choose the advised strategies, audiences, angles, tools, but media-buying has no proven success methodologies. There are just too many factors that live their own lives. Media-buying has become a data-driven art where success is mostly determined by a media buyer’s analytical skills, creativity and the quality of data. You may have unconventional strategies and ambitions, but how can you be sure they really work and where is the right moment to pivot?
Only a quality ad reporting platform may answer these questions.
The Good, the Bad and the Ugly Reporting
As you’ve noticed, we love conducting customer surveys to learn more about their needs and desires. ( By the way, you may still take part in one of them. Maybe you have special features requests or valuable feedback that can help improve the product? Tell us about it!)
Having analyzed the results, we were pleasantly surprised that RedTrack reports are one of our customers’ favorite features. Why you’d ask?
Here’s what we found out:
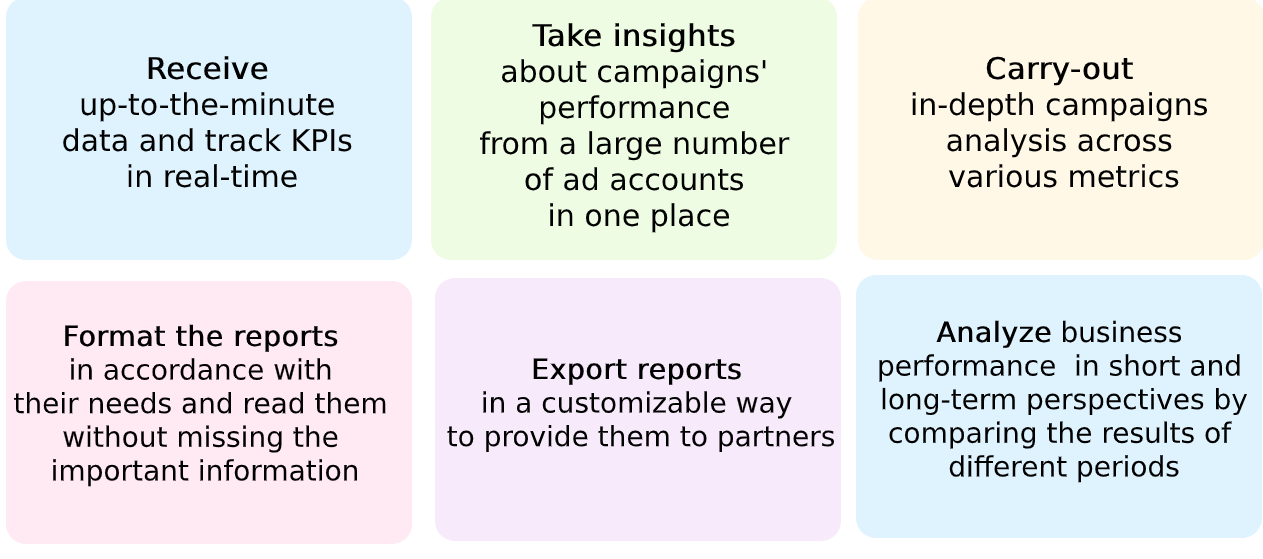
6 features media-buyers value in ad reporting platforms include the opportunity to
If you go into Campaigns – > Report into your RedTrack account you’ll see a pretty and friendly dashboard that can become your loyal and indispensable assistant in making money. But first,
Why do media-buyers choose RedTrack Reports over others?
It’s a good question, actually. Today ad reporting platforms descriptions may look the same to users. Every business understands that media-buyers need reliable and accurate data and sometimes may hide their pitfalls under vague terms. What about RedTrack?
1. Reliable no-sampling data
While many industry newcomers may not take the data collection methodology seriously, it’s an important point that determines the accuracy of the data you get and the quality of decisions you make. When sampling, the platform analyzes a specific subset of data and makes the assumptions about the entire set on the basis of this part, instead of analyzing the whole data set. Yes, this method is much quicker than a non-sampling one. That’s why a lot for big advertising platforms like Google use it. But sometimes you’ll pay too much for this speed.

2. 30+ metrics for analysis
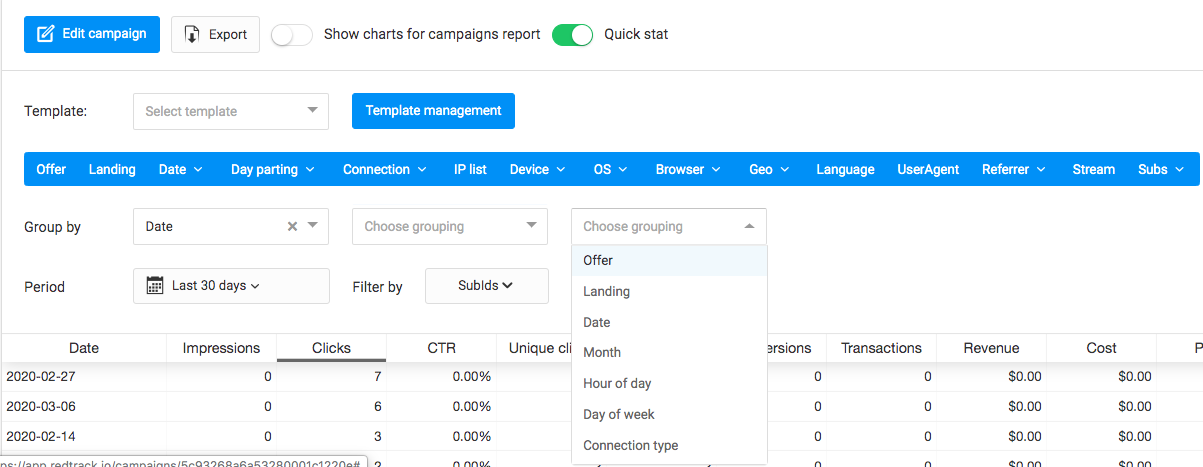
Everything you need to see the detailed picture of ad campaigns: Offer, Landing, Date, Date parting, Connection, IP, Device, OS, Browser, GEO, Language, Referrer, Stream, SubID and others:
3. Customization
There are several ways you can customize your dashboard and reports and make them look the way you or your client want. Here are they:
-
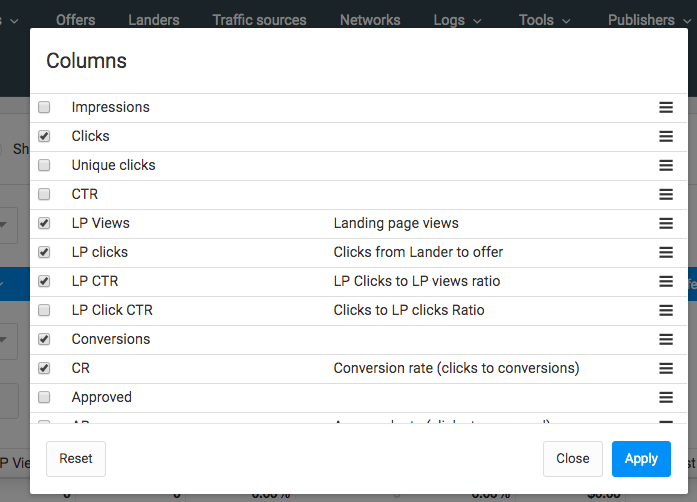
- Clicking on the hamburger-menu button at the right corner of your dashboard, you can customize your entire dashboard, adding, hiding and re-ordering all the available columns and metrics
- Clicking on the hamburger-menu button at the right corner of your dashboard, you can customize your entire dashboard, adding, hiding and re-ordering all the available columns and metrics
-
- Filtering your subIDs, you can create custom reports based on one or several subIDs. It allows you to limit the data to one country, audience characteristics, device type, and others.
- Choosing the metrics to be grouped, you can order your Campaign data by the needed parameters.
By the way, there’s no need to always take your laptop with you to stay up-to-date with the performance of your campaigns. RedTrack Reporting Dashboard not only from the web-application. There’re free mobile apps for Android and iOS users where you can track your ad campaign anywhere and anytime.
Okay, we have quality data. How to make it work for the good of your business? Analyze!
Analyze your data in a smart way
It may sound pretty obvious, but to make a good analysis, you need a plan. Remaining purpose-driven will focus your work, save you time in the long run and improve your business reporting outcomes.
Before digging into numbers, you need to determine:
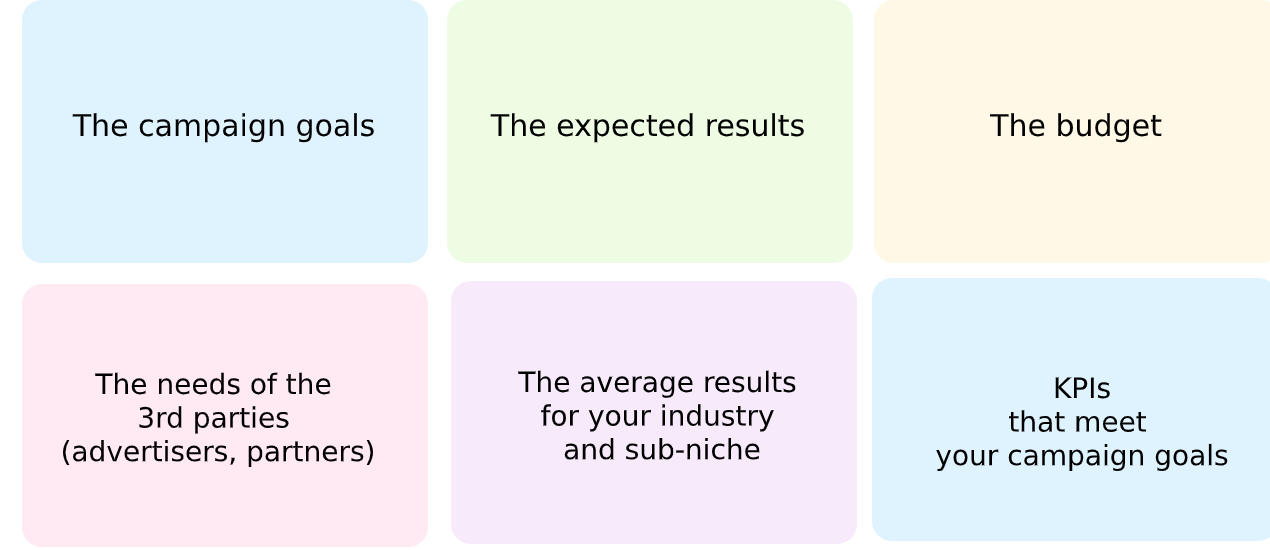
There are various KPIs that you may follow with the help of RedTrack. But you don’t have to focus on all of them. How to choose the right ones? Let’s see
6 KPIs to track into Reports
-
Clicks
The Role: determine the volume of traffic your ads and links bring to the website.
The importance:
Some mature experts are pretty skeptical about high clicks metric unless they drive conversions. However, if you’re at the bottom of your sales funnel and want to build awareness, click and impressions are basically the main metrics you want to track. It reflects the audience’s interest and with the help of A/B testing, you can establish a connection with your target audience. Try different text, pictures, angels and move on through the sales funnel.
The formula: clicks are just clicks:).
- CR (Conversion Rate)
The Role: shows the % visitors converted after interaction with your ads and links
The importance: CR helps you to see how effectively your landing page/banner (if direct-linking) delivers the promise you’ve made and how well it justifies the users’ expectations. If you have a 10% CR, it means that 10 users out of 100 who visited your website, took the specific actions (purchased a product/sign up/ download/leaving contact details).
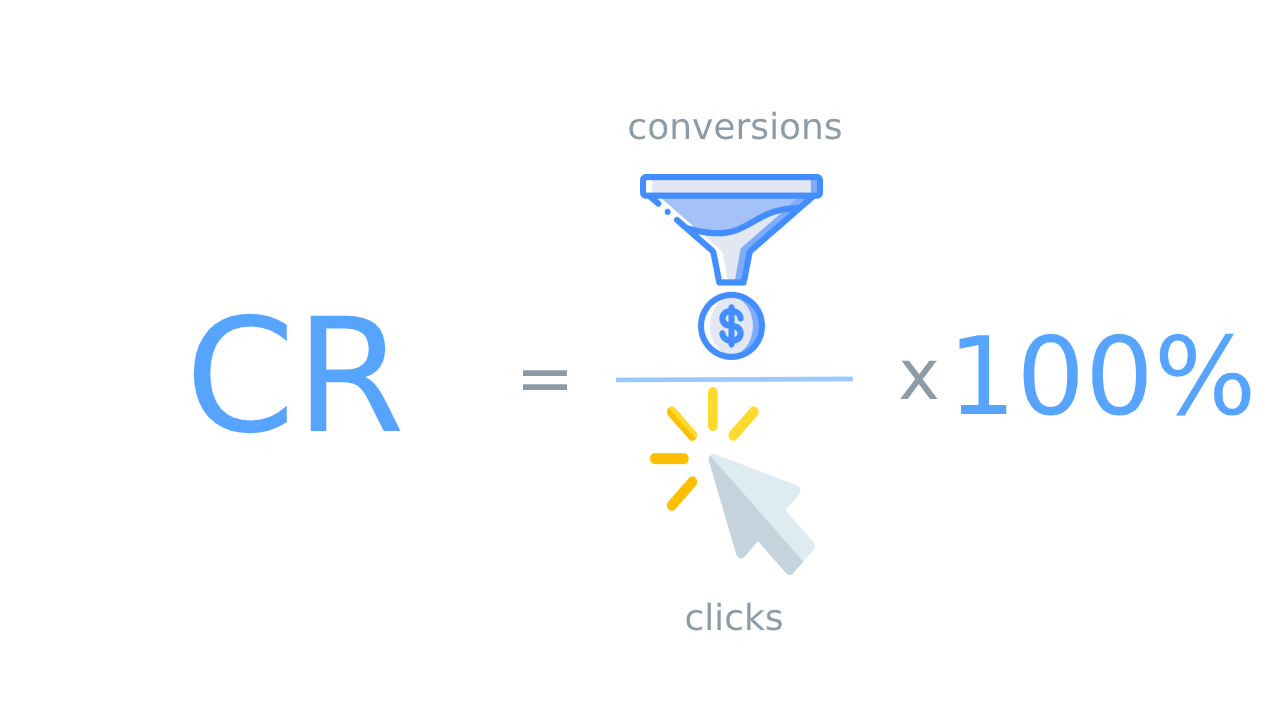
The formula: CR = (Number of Conversions / Number of Clicks) x 100
-
CTR (Click-through rate)
The Role: helps you understand which types of your ads and links get the most interest.
The importance: As a Clicks metric, CTR doesn’t really relate to the economics of your ad campaign, as it doesn’t reflect any action you’d like your prospective customers to take after visiting your LP. But it can clearly demonstrate how your messages and ads are relevant to your target audience.
So, if your main goal is to sell, it can be far more effective to focus on tracking KPIs that reflect actual value to your business, such as ROI, revenue, or CPA.
The formula: Click/ Impressions
-
ROI (Return on Investment)
The Role: clearly shows how much revenue you make for each $ spent on the ad campaign.
The importance: When calculating your ad campaign ROI, RedTrack doesn’t take into account all your operating expenses (subscription fees, publishers payments, etc). But while it doesn’t reflect your overall business performance, it demonstrates the investment efficiency you’ve made in your affiliate program and their success compared to similar programs.
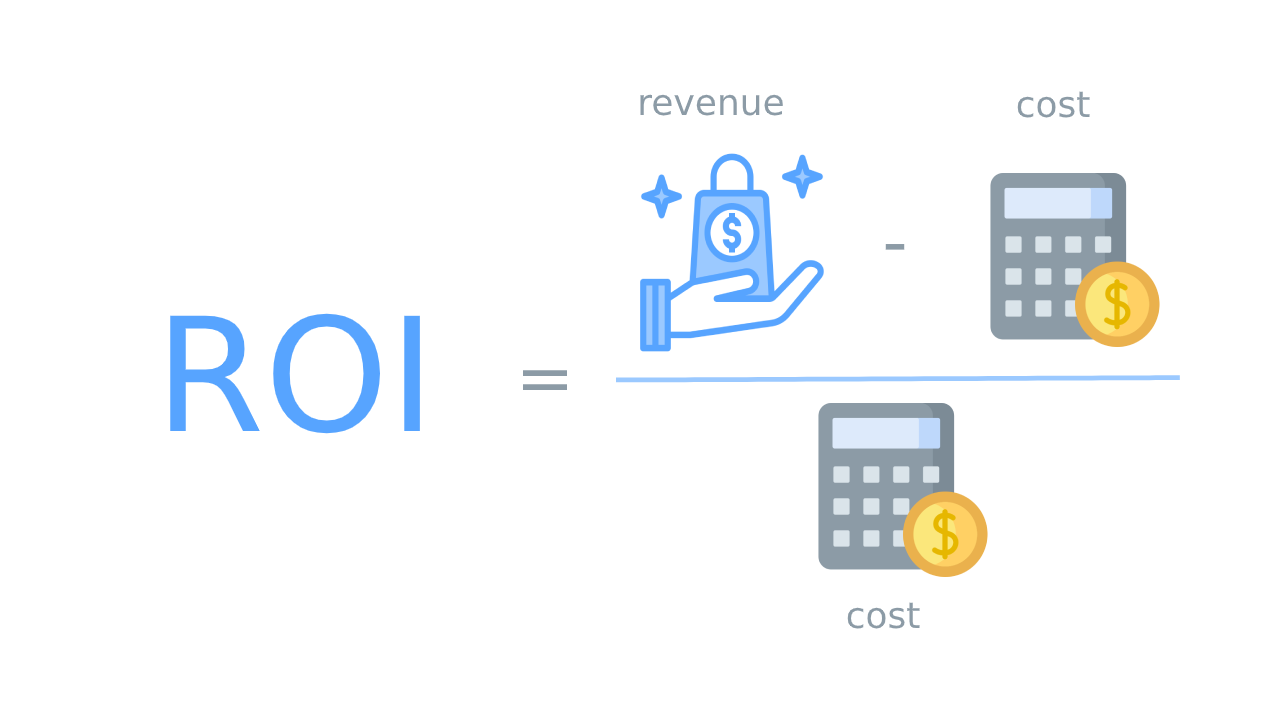
Campaign ROI formula: (Campaign Revenue – Campaign Costs) / Campaign Costs
-
CPA ( Cost Per Acquisition)
The Role: shows how much it takes you to acquire a new customer/lead.
The importance: there are no pitfalls and hidden meanings here. If you see that your CPA is high, that means that your campaign is not so effective, and you have either to make adjustments to lower the campaign costs or increase the number of customers gained.
The thing about CPA is that it won’t provide you with meaningful insights apart from other metrics. To determine whether you have a good CPA, you compare it with the average revenue per customer. It’s easy. Just divide your Revenue by the number of customers you’ve got. With it, you’ll be able to see whether your investments into the acquisition are paying off. For example, if you’re spending 20$ per customer acquisition but only get 10$ from it, then it’s a sign for you to change something into your strategy.
The formula: Total Campaign Cost / Total Number of Customers Acquired Through the Campaign
-
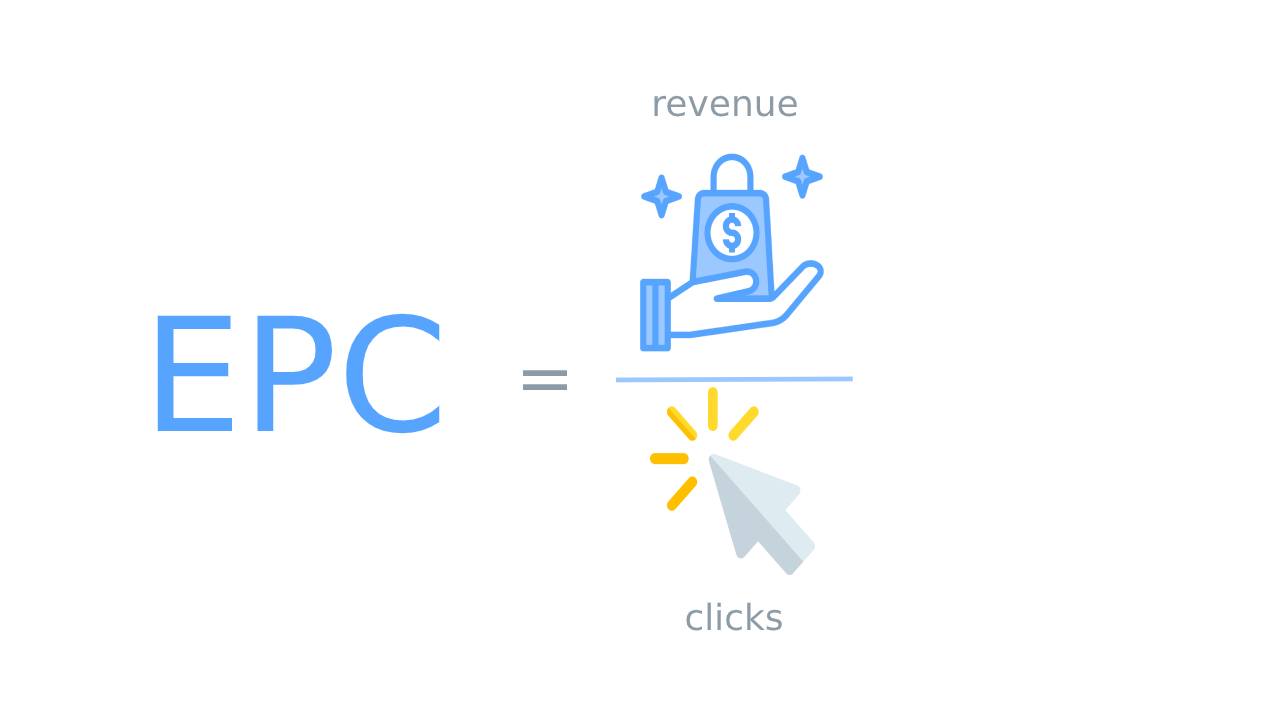
EPC ( Earnings per Click)
The Role: shows how much money you make per person who clicks on your ad
The importance: it varies. On the one hand, If your EPC> CPA, it may be a sign to start scaling and spend more on users’ acquisition. But it’s not a rule of thumb, especially if you work with affiliates. Here’s why: it’s likely that the affiliates will use different promotion strategies and tactics. Let’s take content and coupons, for example. These methods have different natures and usually bring different clients, so it’s not quite right to put together the EPCs they generate.
The formula: Revenue /the number of clicks generated
Can you show me how should I track my data?
With pleasure. We’ll be happy to show you everything in person. Just pick the time and request a demo with one of our Product Specialists.


