Dashboard is the first screen that every user sees when launching a tracker. While working with dozens, hundreds, or thousands of ad campaigns, dashboard with data tables is a place where you can take a quick overview into your ad campaigns’ performance without going into details.
To make data analysis easy and, what is more important, efficient, a user needs to customize the way they view the data. With this in mind, we introduced data table customization feature to RedTrack users.
What is Data Table Customization in Tracker?
Customized tables allow you to build your own tailor-made dashboards from inside the RedTrack interface. Use this feature and create flexible monitoring of ad campaign performance.
To customize data table you can choose the metrics you want to be displayed/ hidden, or change the order how the metric columns are shown in the interface.
Find the inverted “hamburger-menu” button ![]()
Among the metrics that you can add/ hide or re-order within data table customization:
— Date;
— Impressions;
— Clicks;
— CTR;
— Unique clicks;
— LP views;
— LP clicks (clicks from Lander to Offer);
— Conversions;
— CR;
— Transactions;
— Revenue;
— Cost;
— Profit;
— ROI;
— CPC;
— CPA;
— CPT (cost per transaction);
— EPUC (earning per unique click);
— LP CTR (LP clicks to LP views ratio);
— etc.
RedTrack users can access data table customization feature not only for its main Dashboard tab, but for all the tabs inside the tracker, namely:
— Campaigns dashboard
— Edit Campaign dashboard
— Offers dashboard
— Landers dashboard
— Domains dashboard
— Networks dashboard
— Traffic Sources dashboard
— Logs (i.e. clicks, conversions, postbacks) dashboards
Use data table customization feature to easily select and position the metrics you want to view and have this data in your own customized table reports.
As an example, let’s take a look at several real-life cases.
Case #1
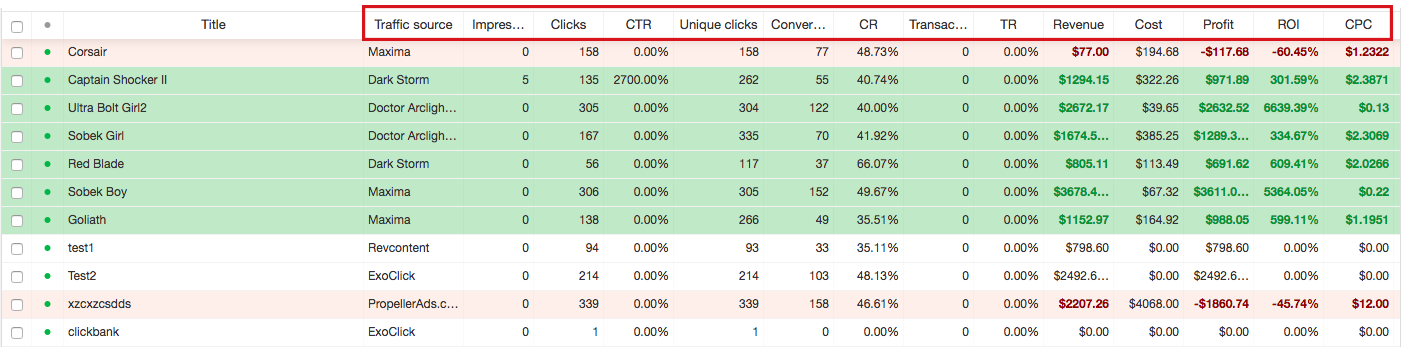
When a user works with, for example, CPI offers they don’t use landing pages and run traffic directly to the offer. In this case they have no need to monitor all the data related to Landers, i.e.:
— LP Views;
— LP Clicks;
— LP CTR (LP clicks to LP views ratio)
— LP Views CR (Conversions to LP views ratio)
— LP Clicks CR (Clicks to LP clicks ratio)
In their case their data table might have the following look:
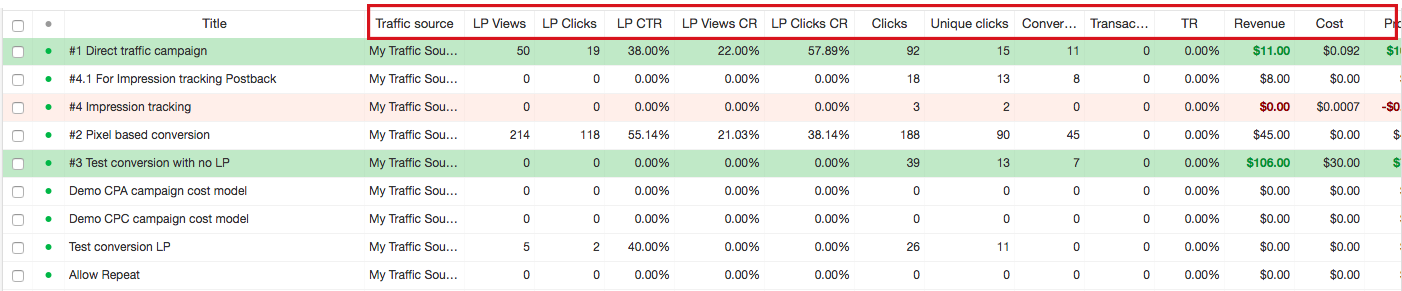
Case #2
The other way around, user’s ad activity largely depends on their landing pages performance. In this case, they might want to see all the metrics regarding the landers’ performance above all else.
These are just the examples of two extreme cases. Use data table customization feature to extract maximum value from monitoring and analytics within your particular conditions and requirements.
Should you have any further questions about data table customization or any other RedTrack feature, please contact support@redtrack.io and our team would be happy to assist you. Join our Community on Telegram to stay in tune with all RedTrack updates, news, and giveaways!